Table of Contents
Webservice Stress Tests
Select with limit and related
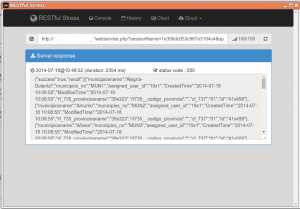
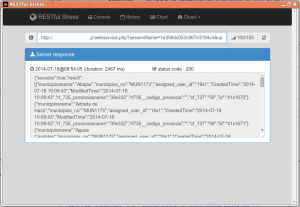
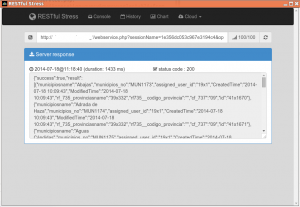
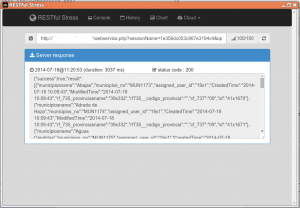
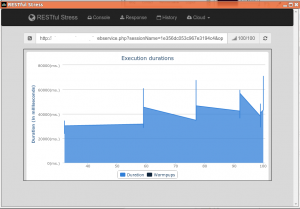
Using the very useful RESTful Stress Chrome application I ran a set of test on some of the webservice interface functionality.
This is definitely not rigorous nor exact, I have not controlled any of the many variables that can influence the results. I just launched the tests while I was working against a live server. None the less I understand that the results must mean something and, at least, give some orientation.
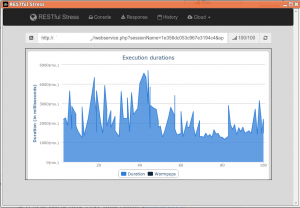
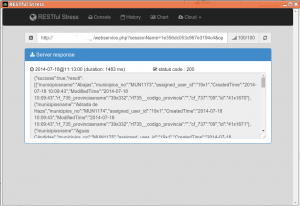
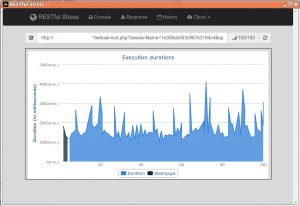
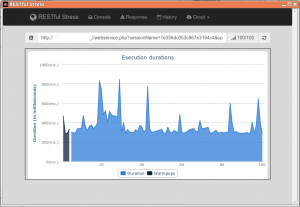
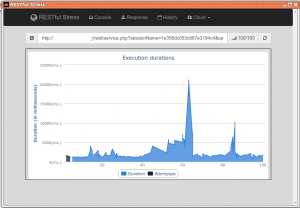
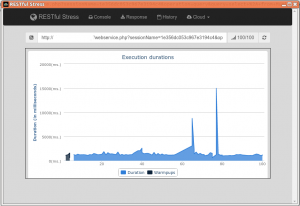
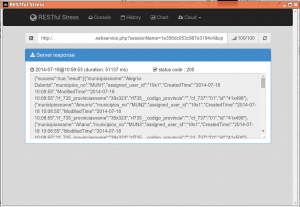
This is the general setup screen: I launched each select query 100 times after 4 warmup calls with an interval of 1 second between each call.

select * from Municipios limit 371;
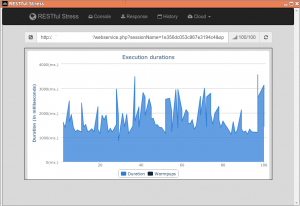

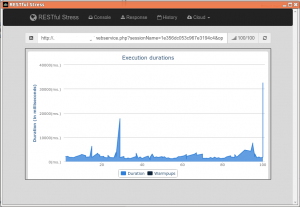
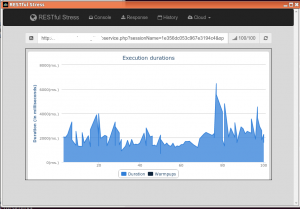
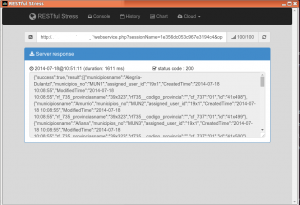
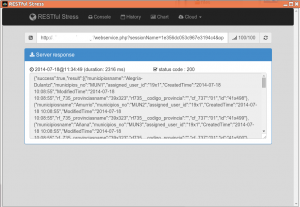
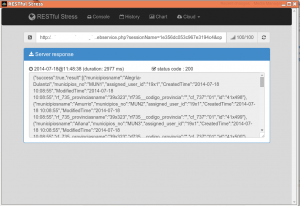
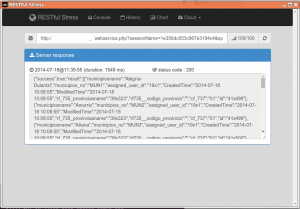
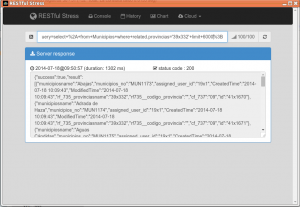
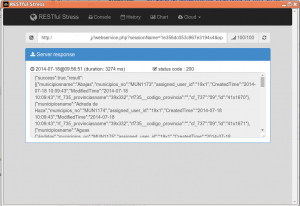
select * from Municipios where related.provincias='39×332'; (which returns 371 records, so the comparison is on the same number of records of the same type)
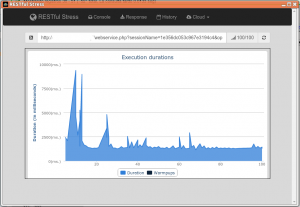
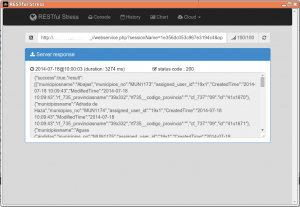
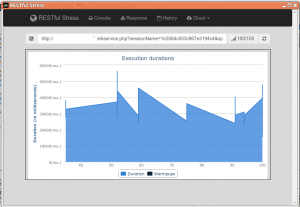
a set of different size selects against the same server and same module

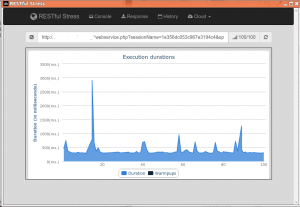
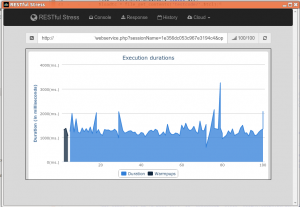
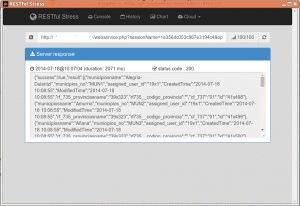
The numbers are (all values are in microseconds):
| select 10 records | |
|---|---|
| 1 | 292 |
| 2 | 304 |
| Avg | 298 |
| Time per record | 29.8 |
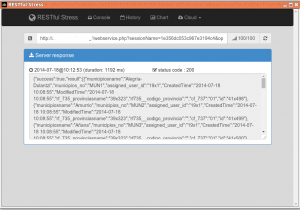
| select 6000 records | |
|---|---|
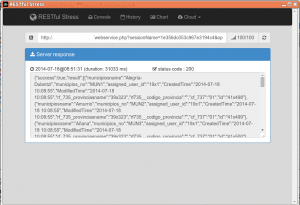
| 1 | 31033 |
| 2 | 51137 |
| Avg | 41085 |
| Time per record | 6.8 |
| select 332 records | |
|---|---|
| 1 | 1738 |
| 2 | 2071 |
| 3 | 1774 |
| 4 | 1192 |
| Avg | 1694 |
| Time per record | 5.1 |
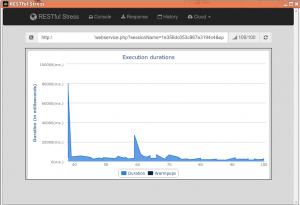
| select 371 records | |
|---|---|
| 1 | 2676 |
| 2 | 2354 |
| 3 | 1611 |
| 4 | 1547 |
| 5 | 2316 |
| 6 | 2977 |
| 7 | 1549 |
| Avg | 2147 |
| Time per record | 5.7 |
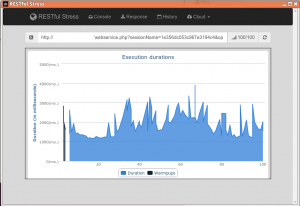
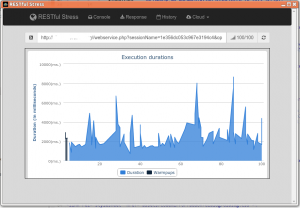
| select related 371 records | |
|---|---|
| 1 | 1302 |
| 2 | 2467 |
| 3 | 3274 |
| 4 | 3274 |
| 5 | 1483 |
| 6 | 1433 |
| 7 | 3037 |
| Avg | 2324 |
| Time per record | 6.2 |
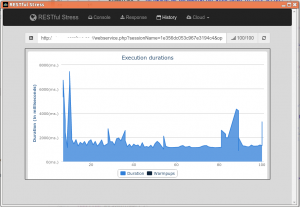
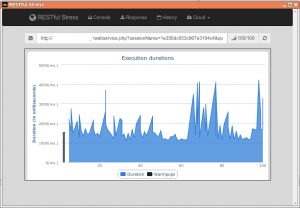
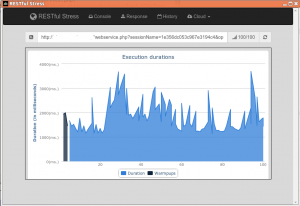
It is interesting to see that the time per record decreases as the number of records retrieved goes up, which seems logical as the setup time is divided among all the records.
The original question that motivated these tests was if a select using the related record enhancements was faster or slower than a normal select. From the tests above it seems that a normal select is a little faster which also seems logical due to the extra effort to establish the relation and then the extra join in the query.
Create records
The stress creation test was performed using the Siege tool available at joedog.org. With this very powerful tool it is easy to launch any amount of concurrent transactions against the coreBOS webservice interface.
The question I was trying to answer with the tests was: “How long will it take to create 2300 records via REST?”. To answer this question I launched this test:
http://your_server/your_corebos/webservice.php
 POST
 sessionName=6906a95d53ca39308580c
 &operation=create
 &elementType=Services
 &element={"servicename":"srvrest2","assigned_user_id":"19x1","unit_price":"23","description":"just some random text so the rest call has some information being sent","qty_per_unit":"2"}
I launched this 230 times with 10 concurrent users twice and then I launched it 115 times with 20 concurrent users. I did those 4 tests against two different servers.
| Server 1 | Server 2 |
|---|---|
| Intel(R) Xeon(R) CPU E5320 @ 1.86GHz 8 core with 8Gb ST3300655SS • Cheetah® 15K.5 SAS 3Gb/s 300GB Hard Drive | Intel(R) Xeon(R) CPU E31220 @ 3.10GHz 4 core with 8Gb SPS-DRV SAS HD M6612 de 450 GB, 15.000 rpm, LFF |
Server 1
Trans,  Elap Time,  Data Trans,  Resp Time,  Trans Rate,  Throughput,  Concurrent,    OKAY,   Failed
2300,     595.77,           1,       2.04,        3.86,        0.00,        7.88,    2300,       0
2300,     588.32,           1,       2.02,        3.91,        0.00,        7.89,    2300,       0
2300,     591.97,           1,       4.53,        3.89,        0.00,       17.61,    2300,       0
2300,     591.91,           1,       4.49,        3.89,        0.00,       17.45,    2300,       0
Average time is 591.99
Server 2
Trans,  Elap Time,  Data Trans,  Resp Time,  Trans Rate,  Throughput,  Concurrent,    OKAY,   Failed
2300,     469.91,           1,       1.47,        4.89,        0.00,        7.22,    2300,       0
2300,     466.26,           1,       1.46,        4.93,        0.00,        7.23,    2300,       0
2300,     455.86,           1,       3.22,        5.05,        0.00,       16.23,    2300,       0
2300,     474.59,           1,       3.28,        4.85,        0.00,       15.90,    2300,       0
Average time is 466.65
It is curious to see that although I double the concurrency the creation time stays stable, which I understand means that it doesn't matter how many requests you get, the creation time is the same (as long as you don't saturate the server resources in which case the bottle neck would move elsewhere).
The difference between one server and the other is incredible (really!), 591.99-466.65=125.34 2 minutes!!. So our first conclusion is something I have been saying for ages: hardware, specially hard disk is of utmost importance.
We are roughly talking about 8-10 minutes to create 2300 records which is 287-230 records per minute but we have to keep in mind that I intentionally picked a module with NO workflows associated. If we launched these tests against HelpDesk I'm sure the difference would be worse.
vtiger CRM Comparison
Just for fun I tried the same set of test against a vtiger CRM 5.4 on server 2 that seemed to be doing better than server 1. These are the results:
Server 2 vtiger CRM
Trans,  Elap Time,  Data Trans,  Resp Time,  Trans Rate,  Throughput,  Concurrent,    OKAY,   Failed
2300,     547.00,           1,       1.84,        4.20,        0.00,        7.72,    2300,       0
2300,     540.27,           1,       1.81,        4.26,        0.00,        7.71,    2300,       0
2298,     546.74,           1,       4.02,        4.20,        0.00,       16.92,    2298,       2
2300,     570.77,           1,       4.13,        4.03,        0.00,       16.66,    2300,       0
It can be clearly seen that the effort we are putting in on optimizations and other enhancements are working: it is over 1 minute difference!!